The Math Behind Consistent Revenue Without the Weekly Grind
The biggest fear most webinar-based coaches have about switching to a front-end funnel model isn't the tech.
It isn't the product creation.
It isn't even the learning curve of running paid traffic.
It's this: what if I spend money on ads and it doesn't come back?
That fear is completely reasonable. Most coaches who've tried paid traffic before have lost money on it. The memory of watching ad spend disappear with nothing to show for it is enough to make anyone hesitant to try again.
But here's what's worth understanding.
The reason most ad campaigns fail has almost nothing to do with the ads themselves. It has everything to do with the math sitting behind them. Specifically, whether the funnel is structured to recover the cost of the traffic on the front end, or whether it's hoping the back end saves it.
When you understand the math, running ads stops feeling like gambling. It starts feeling like arithmetic.
Two Businesses, Two Different Relationships With Money
Let's look at two coaches running paid traffic.
Coach A sends traffic to a free webinar registration page. She spends $8 to get a registration. Show-up rate is 35 percent, so her real cost per attendee is about $23. Her webinar converts at 10 percent to a $997 program. That means she needs 10 attendees to make one sale, which costs her $230 in ad spend to generate a $997 sale. On paper that looks profitable.
But here's what the math doesn't show. Of the 100 people who registered, 65 never showed up. She paid $8 for each of them and got nothing back. Her free lead magnet put them on a list where they'll receive emails but probably never buy anything. She's carrying the cost of 65 useless registrations in every campaign she runs.
Coach B sends traffic to a $27 front-end product with a $17 order bump and a $47 upsell. Her average order value is $43.
Her cost per acquisition is $35. She makes $8 on every buyer before her back end ever comes into the picture. Every person on her list has already paid to be there. Her back end doesn't have to save the campaign because the campaign is already profitable.
Same ad platform. Same general market. Completely different financial outcome because of funnel structure.
The Three Numbers That Determine Everything
There are only three numbers that matter when you're evaluating whether a front-end funnel can work for your business.
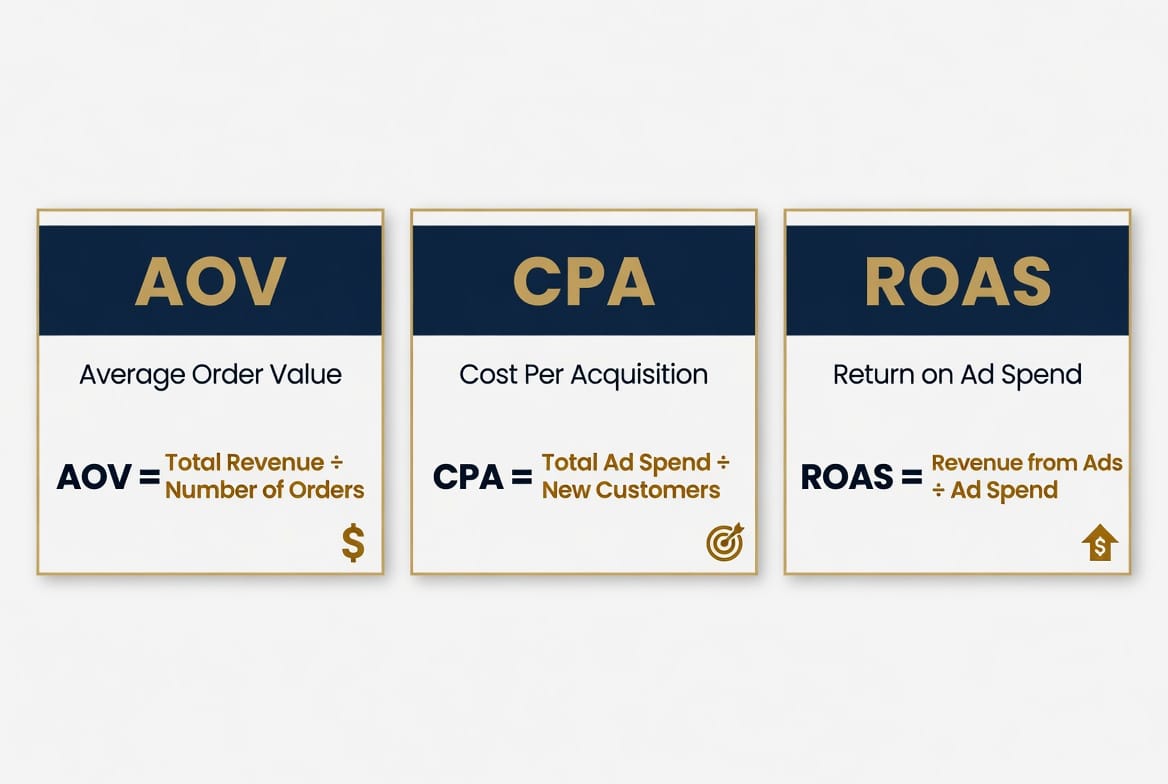
Number 1: Your Average Order Value
This is the average amount of money a buyer spends in a single transaction going through your funnel. It includes the front-end product, the order bump if they take it, and the upsell if they take it.
The formula is straightforward. Take your front-end price. Add the order bump price multiplied by its conversion rate. Add the upsell price multiplied by its conversion rate. That's your AOV.
For Marcus, it looked like this:
$27 base product plus $17 order bump at 31 percent equals $5.27. Plus $47 upsell at 22 percent equals $10.34. Total AOV: $42.61.
Number 2: Your Cost Per Acquisition
This is how much you spend on ads to generate one buyer. It accounts for your ad spend, your landing page conversion rate, and your sales page conversion rate all together.
If you spend $100 on ads and get three buyers, your CPA is $33.
Number 3: Your ROAS
Return on ad spend. Divide your total funnel revenue by your total ad spend. A ROAS of 1.0 means you're breaking even.
Above 1.0 means your front end is profitable. Below 1.0 means you're losing money on the front end.
The target in the early stages isn't a high ROAS. It's 1.0. Break even on the front end and everything else is gravy.
What Break-Even Actually Means for Your Business
Most coaches hear "break even" and think that sounds disappointing. Why would you run ads to break even?
Because breaking even on the front end means your buyers are free.
Every person who comes through your funnel at break-even cost you nothing net. Your ad spend went in, your AOV came back out, and you're left with a buyer on your list at zero cost.
That buyer will receive your Bridge email sequence. Some will book discovery calls. Some of those will close into your coaching program. Some will buy future offers you haven't even created yet. All of that back-end revenue comes from a buyer who cost you nothing to acquire.
That's what infinite scale means in practice. When the front end breaks even, you can spend more on ads without losing money. When you spend more, you get more buyers. When you get more buyers, the back end compounds. The business grows without you having to perform weekly to feed it.
Marcus hit break-even on day 19 of his first campaign. From that point forward every dollar he put into ads came back out as front-end revenue plus a new buyer on his list. His back-end coaching program did $14,000 in that month, entirely from buyers who had come through the funnel in the previous three weeks.
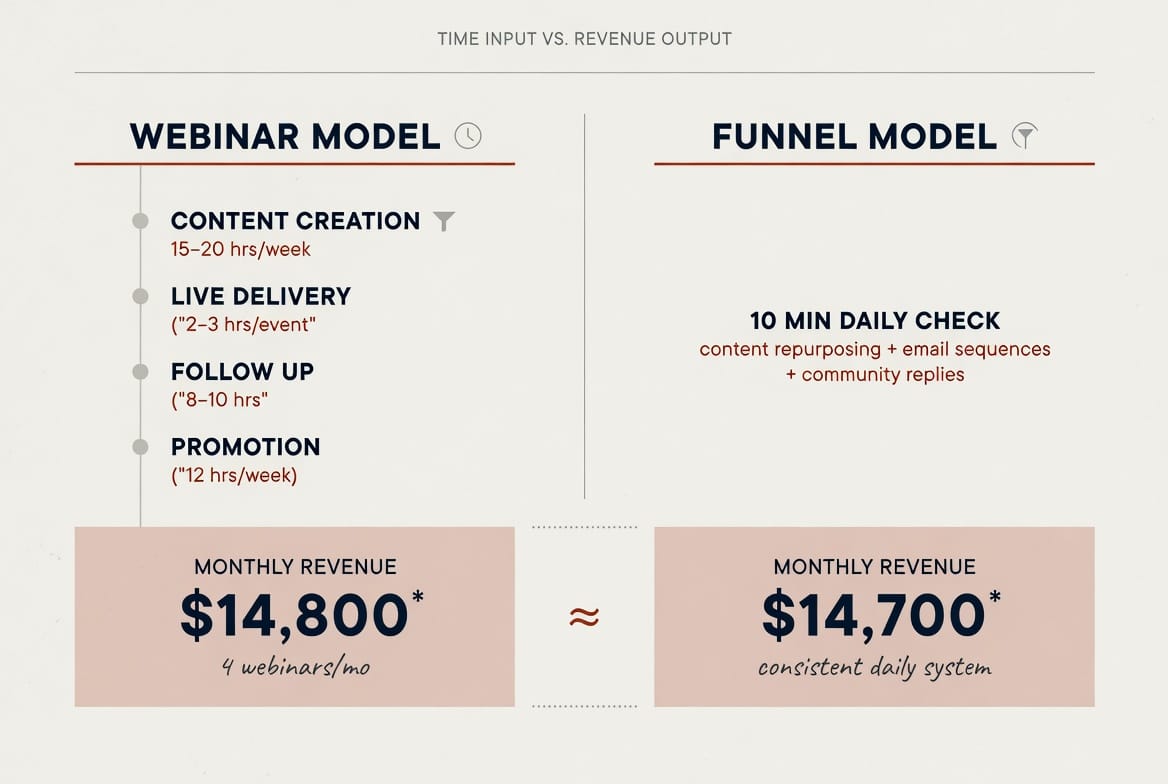
The Webinar Math Versus the Funnel Math
Here's a direct comparison that makes this concrete.
Marcus's webinar was generating roughly $10,000 a month when he was running it every week. Let's look at what that actually cost him.
Weekly webinar promotion: 3 to 4 hours of content creation and ad management. Weekly webinar delivery: 90 minutes on camera plus 30 minutes of setup and follow-up. Weekly follow-up sequence management: 1 to 2 hours. Total time investment per month: roughly 28 to 32 hours of active work just to maintain that $10,000.
Now the funnel math.
Once the funnel was built and the campaign was optimized, Marcus's weekly time investment dropped to about 10 minutes a day checking ROAS and making budget adjustments. The funnel generated $11,000 in its fourth month with roughly 70 minutes of total active management that month.
Same revenue. One-thirtieth of the time.
The money math and the time math both point in the same direction.
The Diagnostic When the Math Isn't Working
Not every funnel hits break-even immediately. Sometimes the first version of the math doesn't work and you need to know which lever to pull.
There are only two levers.
Lever 1: Increase your AOV.
If your CPA is $40 and your AOV is $32, you're losing $8 per buyer. The fix is on the revenue side of the equation. Look at your order bump first. Is it priced correctly? Is the copy on the checkout page describing it clearly? A poorly written order bump description can cut conversion rates in half. Test a different price point. Test a different description. A 5 percent improvement in order bump conversion rate can add $3 to $5 to your AOV.
If the order bump is already optimized, look at the upsell. Is the offer clearly positioned as the logical next step from the front-end product? Is the price point appropriate for someone who just spent $27? A upsell priced too high relative to the front end will underperform regardless of how good the offer is.
Lever 2: Reduce your CPA.
If your AOV is solid but your CPA is too high, the problem is either your ad creative or your landing page conversion rate.
Ad creative first. Are you testing two different angles? Is the hook specific enough to stop someone mid-scroll? Does the ad clearly communicate who it's for and what problem it solves in the first three seconds?
Landing page second. Is the headline matching the promise of the ad? Is the page too long, too short, too complicated? A landing page that converts at 2 percent versus 4 percent cuts your CPA in half with no change to your ad spend.
Marcus's first version of the funnel had a CPA of $51 and an AOV of $43. He was losing $8 per buyer. He rewrote his landing page headline and changed his order bump description. Two weeks later his CPA was $34 and his AOV was $44. The funnel flipped from losing money to making $10 per buyer from the same ad campaign.
What This Means for the Webinar Business
Understanding this math changes your relationship with the webinar model too.
Once you have a front-end funnel breaking even or better, the webinar stops being a survival mechanism and becomes an amplifier. You run it when you want to accelerate growth, not because you have to in order to pay your bills.
That shift in relationship produces a different quality of webinar. When you're not desperate for the revenue, you show up differently. You're less pushy. More generous with the content. Easier to trust. And counterintuitively, that version of the webinar closes better than the one you were running when the mortgage depended on it.
Marcus's webinar close rate after building the funnel was consistently 4 to 6 percentage points higher than it was before. He attributed most of that to the fact that he stopped showing up to webinars feeling like he needed to make rent.
The math of the funnel made the webinar better. Not by changing anything about the webinar. Just by removing the financial pressure that was quietly degrading his performance every week.
The Only Question Left
You now understand the three numbers. You know what break-even means and why it matters. You know which levers to pull when the math isn't working. And you understand how the funnel changes the financial profile of the webinar business you already have.
The only question left is how to actually build the thing. The product, the stack, the ad setup, and the daily process for managing it without it taking over your life.